
Resources / The Evolution Blog
Using the Poisson Process to Detect Online Fraud Patterns
Andrew Feutrill

“Everything old is new again” — Jonathan Swift 1667–1745
At Darwinium - a cyberfraud prevention platform — our scientists utilize state-of-the-art statistical and machine learning techniques to build fraud detection capabilities that are robust to noisy measurements and uncertainty, to produce deep insights for our customers. However, we also utilize models which have a much longer history, such as traditional statistical and probabilistic models, and apply them in novel ways to keep ahead of evolving fraudulent behavior. In this post we will describe a historically significant stochastic model, the Poisson process, which models time-based random events, and describe our direct applications to fraud:
- Modelling the volumes of customer events, and looking for unusual changes.
- Modelling device updates.
- Time between fraud events.
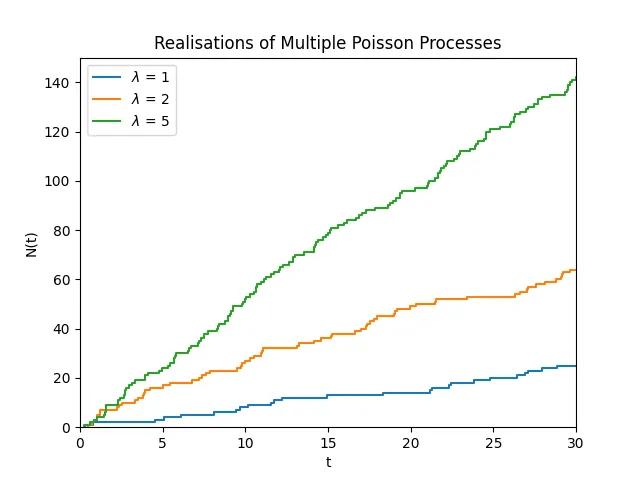
This plot shows the evolution of different Poisson processes with different rate parameters. The higher the rate the quicker the time between events.
Historical Applications
The Poisson process emerged in the early 20th century and is named after the relationship of random points emerging in time, to the distribution of points on fixed intervals, i.e. the Poisson distribution. In particular it has proved effective in the following applications:
- Epidemiology, for modelling epidemic spread for diseases such as Influenza (and recently COVID-19).
- Ecology, modelling the distribution and spread of different plant and animal species.
- Very widespread usage in telecommunications by Erlang. Creating the field of teletraffic engineering and independently creating the process from the independence of call arrivals.
How does Darwinium Utilize Poisson Processes
Darwinium ingests and analyzes huge amounts of data in multiple contexts, and much of this can appear random at first. However, utilizing Poisson processes we are able to derive deep insights into seemingly unpredictable phenomena to prevent fraud. Some examples are given below:
Modelling of the Volume of Events
It’s critical for fraud analysts to understand the total volume of events relative to typical levels, because this can give real time warning signs to identify potentially risky behaviors, for example:
- Detecting automated bot attacks or human click farms.
- Detecting individuals or groups of individuals engaged in similar patterns of behavior, such as mule activity, coercive behaviors indicative of scams, collusive play or problem gambling.
We can utilize a nice property of the Poisson process to model and perform inference on complex time series. Generally, we have a variety of lower granularity time series that contribute to the overall time series that we are interested in. Then we can model the overall time series as a sum of all of the lower granularity time series, and importantly the sum of a Poisson process is itself a Poisson process.
Therefore in aggregate we can make accurate forecasts on the total number of events of different granularities. This framework can identify when the nature of traffic fundamentally changes, by being able to forecast and identifying anomalies using the Poisson distribution over a fixed timeframe, which we use to help businesses identify potential fraud emerging due to increased human or automated traffic.
Modelling Device Changes
Understanding changes to devices is particularly helpful to uncover fraudulent behavior relating to users attempting to bypass fingerprinting tools or appear as a “new” user.
We can model device changes over time utilizing Poisson processes to understand the time between attribute updates. For particular attributes, the time between changes is very well modelled by an exponential distribution, which is driven by humans interacting with the device to produce the randomness in time of event.
Then we are able to calculate the probability that a device attribute has changed, and hence can derive insight into the how likely it is that a given device attribute hasn’t changed. This can indicate fraudulent behavior of devices, and groups of devices, that differ from normal user behavior.
Modelling Journeys on Websites
The concept of a user journey can be particularly helpful in the context of identifying unusual user behaviors that other solutions may not typically detect, such as scam behaviors where a good user is being coerced to do something bad.
Darwinium is very focused on modelling how fraud evolves in the form of a user journey — a series of steps that a user takes when traversing a website. It’s important to separate trusted patterns of behavior from high-risk or malicious users. These journeys take the form of discrete steps, with time between each interaction monitored, which can be modelled well by a Poisson process.
Analyzing the common behavior of time between events and sequences, we can infer the time between events, and multiple events. This approach can help detect anomalous journeys by fraudsters, or customers who are being socially-engineered, in comparison to normal user behavior .
What is a Poisson Process?
The Poisson point process, {N(t), t ≥ 0}, is a very well-studied process in probability theory that can be represented in many dimensions or general spaces. However, we will focus on the classic process defined on the real number line. We will define the process by two key properties:
- The number of points in a bounded interval is Poisson distributed with rate λ, that is for a process counting the number of points over time the probability of having n points in time t is
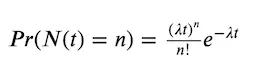
2. Separated time intervals are completely independent of each other, that is for times 0 < t₁ < t₂ < t₃ < t₄ the random variables N(t₄) — N(t₃) and N(t₂) — N(t₁) are completely independent.
Some important properties:
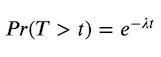
- Inter-event times are exponentially distributed, which gives the memoryless property of the time between events. That is, how much time has already elapsed between events has no impact on the distribution of the remaining time until the next event occurs, which is derived from the survival function for an exponential random variable which is the probability of exceeding a given time:
- The distribution of the number of points on an interval is stationary, meaning that it only depends on the length of the interval. That is, N{(a + t, b + t]}, the number of points observed on the interval (a + t, b + t] is independent of t.
Properties that Enable Enhanced Fraud Detection Capabilities
At Darwinium, we utilize these point processes to model and gain insight into many fraudulent online behaviors.
Addition (Superposition) of Poisson Process is a Poisson Process
If we have n Poisson processes, N₁(t), … , Nₙ(t), each with rate parameters, λ₁, … , λₙ we can form a Poisson process N(t) = N₁(t) + … + Nₙ(t), which is characterised by the rate parameter Λ = λ₁ + … + λₙ. Even more generally if we take independent counting processes, whether they are Poisson process or not, for n “large enough” then their sum is approximately Poisson.
Using this approach we can perform inference on forecasting of the volume of expected events, and utilising that we have the expectation of the processes
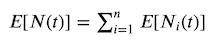
and variance
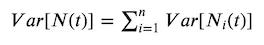
since the processes are pairwise independent and therefore for any pair of processes i and k we have Cov[Nᵢ(t)Nₖ(t)] = 0. Note that due to the covariance being 0 pairwise this means that the variance of the Poisson process is lowest for all possible point processes.
The Distribution of n Events has a Tractable Distribution
Originally analyzed for telephone call arrivals, we can consider multiple events and consider their probability directly by utilising the Erlang distribution, since for k random variables Exponential(λ) ~ Xᵢ, representing k attribute changes we have Erlang(k, λ) ~ X₁ + … + Xₖ. We can apply this to attribute changes for a device of interest and can utilise the Erlang distribution to estimate the likelihood of multiple attribute updates, or no attribute changes, in that time frame.
Inference of the Time Between Events
When we consider the survival function for the exponential distribution, which is the probability that the time between events exceeds a particular time, Pr(T > t). We can see that if we have already been waiting for a period of time s, then the time until the next event follows the same distribution looking forward as if an event had just happened. We can see this mathematically as:
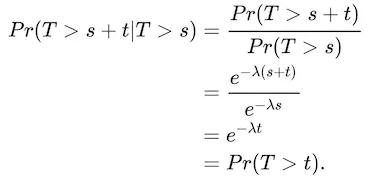
In the language of survival analysis we say that the function has a constant hazard rate, and from an inference perspective we can just consider the time difference from the current time, t, to calculate the probability of next event occurring within a time period.
If you’d like to speak to one of the data scientists at Darwinium to learn more about our innovations in detecting complex online fraud, contact us here.


